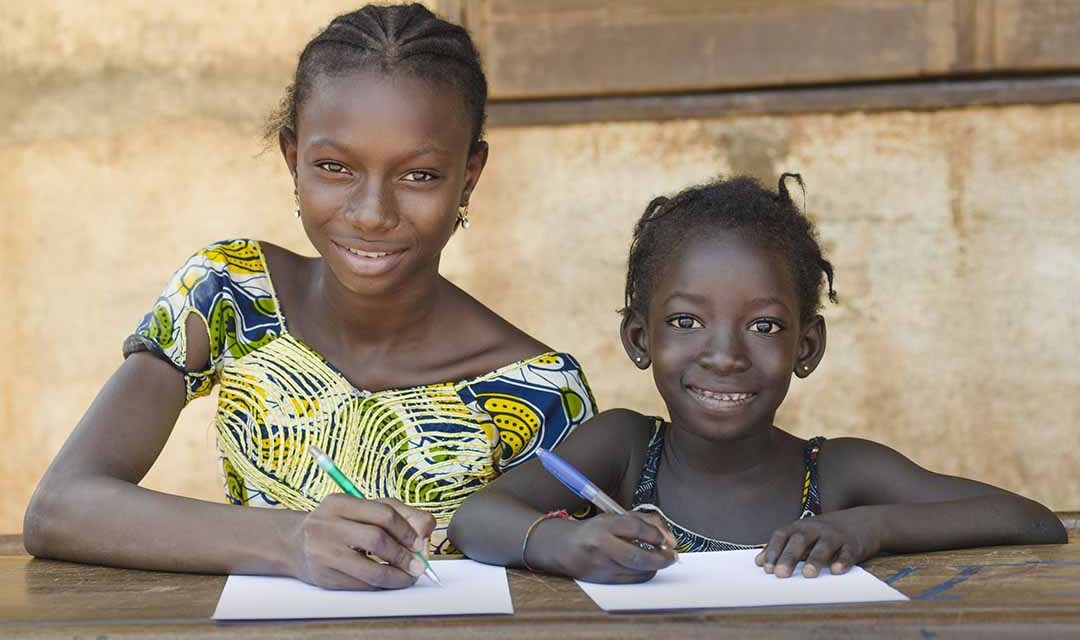
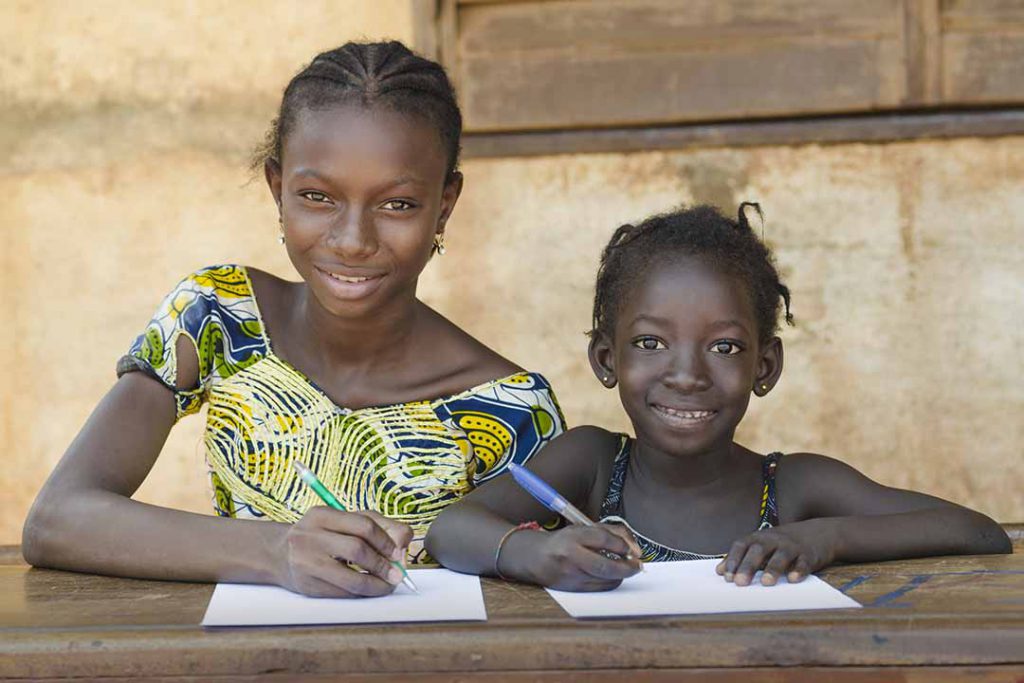
Couple of cute African children sitting in their desk at school in Bamako, Mali.
Entrenched family values and practices appear to play an important role in perpetuating gender inequalities in sub-Saharan Africa
Being a woman in Africa means being exposed to a range of prejudices and biases that are encoded in institutions, discourses and ways of relating, and experiencing the effects of these in material conditions that are divided along gender lines. The struggle has always been not only to minimise material biases, but also to eliminate the non-material, institutional and discursive prejudices from which these arise.
One way to conceive of this is to understand the material conditions of women’s lives as indicators of progress: more equality in material things means more progress has being made. The non-material institutional and discursive prejudices that affect women’s lives can be seen as challenges or obstacles to more progress being made. These non-material discriminatory social institutions pervade the lifespan of African women, limiting their access to justice, rights and empowerment, and compromising their agency and decision-making ability over important life choices.
Such a model does, of course, make a range of assumptions about the drivers of social change, in particular that non-material changes will result in material changes. From this view, these discriminatory social institutions can be understood as underlying drivers of gender inequalities that perpetuate gender inequalities in diverse areas such as education, employment and health, as well as stifling transformation that reduces inequalities.
This article adopts this model and seeks to describe areas in which material progress has been made, as well as areas in which non-material challenges and obstacles persist. It focuses specifically on countries in sub-Saharan Africa and presents an analysis of material and non-material conditions at country level. It will also provide an indication of the size of the problem by simply indicating the size of the female, and especially young female, population in each country.
It is not easy to locate data that spans sub-Saharan Africa. There are typically large gaps in data series, and some countries are notoriously data poor (Somalia and Eritrea are examples of this). This means that analyses and models have to be adapted according to the data that can be gathered. For this article, I have prioritised gathering as full a sample of sub Saharan countries as possible. If an indicator did not cover the vast majority of countries in the region, it was dropped and replaced with another. Somalia, Eritrea, and South Sudan had to be eliminated from the analysis because of a lack of data.
The lack of reliable and consistent gender disaggregated data for sub-Saharan Africa was especially evident with regards to income, GDP, expenditure, or similar. While income statistics such as GDP per capita are relatively easily obtained, these were unavailable by gender. Because of this, as well as the notoriously low validity of income measures even when they do exist, a measure of income has not been included in the model.
Education was proxied by youth literacy, adult literacy and upper secondary school completion rates. In four cases – Botswana, Angola, Equatorial Guinea and Uganda – the data was unavailable and upper secondary school enrolment was used instead. For these countries, this aspect is therefore slightly exaggerated. Life expectancy/health was proxied by life expectancy at birth, HIV prevalence, and mortality rate. All of these variables were disaggregated by gender and obtained from the World Bank Indicators site.
Figure 1: Gender differences across various domains across sub-Saharan Africa

Non-material conditions were modelled using data from the Organisation for Economic Co-operation and Development’s (OECD) Gender, Institutions and Development dataset. This dataset covers five aspects of female-discriminatory social institutions. The first of these is “discriminatory family code”, and covers issues related to marriage age, parental rights after dissolution of marriage, daughter inheritance, and divorce and unpaid care work. The second is “restricted physical integrity”, and relates to social institutions that restrict women’s control over their bodies. Included in this are laws and norms that fail to protect women’s physical integrity and reproductive autonomy, and those that promote gender-based violence, such as FGM.
“Son bias” describes ways in which sons are promoted or offered preferential treatment over daughters; indicators include missing women, preference of sons in educational opportunities, and fertility preference. “Restricted resources and assets” refers to gender-based biases regarding access and ownership of land and financial services. Finally, “restricted civil liberty” relates to issues of access to public space, workplace rights, and having political voice and representation.
All variables were obtained either as percentages or as a score on a range from 0 to 1. Aggregate scores were therefore obtained by ensuring that all variables were scored in the same direction, and then taking mean scores for each domain. Finally, a grand mean was calculated for material and non-material variables for each country. The model also made use of population-related variables, which were collected from the World Bank Indicators site. These indicated country female population size and young female population size (ages five to 30 years).
There were four stages to the analysis. Firstly, major gender gaps in the sub-Saharan region (limited, of course, by the available data) were identified by simply comparing males and females across each of the progress variables. A Mann-Whitney U test was used to identify which of these gaps were significant. All analysis was conducted using R and RStudio statistical software. The results of the analysis are presented in Figure 1.
From Figure 1 it is clear that four of the six variables showed a significant difference between genders. Adult literacy and HIV prevalence were found to be higher for females than males, while life expectancy at birth was found to be higher for women. Unsurprisingly, adult mortality rate was found to be higher for females as well.
When these biases were considered across sub-Saharan countries it was found that the adult literacy rate ranged from much higher for males (in Liberia, Mozambique, the Central African Republic, Togo and Senegal) to higher for females (in Lesotho, Namibia and Botswana).
HIV prevalence was found to display much variation when compared across gender. The greatest differences were found to be concentrated towards the south of the continent. Eswatini (Swaziland), South Africa and Namibia were joined by Malawi and Zambia in the highest ranges.
Like HIV prevalence, adult mortality was found to exhibit the greatest gap between the genders in southern African countries. This is likely due in part to the high HIV prevalence, and to an extent these variables may be measuring the same thing. South Africa was at the top of the list, followed by Eswatini, Botswana, Angola and Namibia.
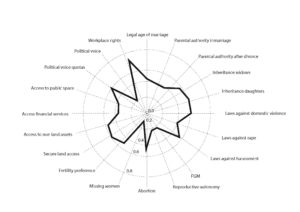
Figure 2: Non-material gender biases; 0 = low bias , 1 = high bias
Life expectancy at birth was the only variable that showed a bias in favour of females; this is, in fact, a global trend. The variable was retained in the analysis, however, because the variation in the gap across the region is still indicative of environmental influences.
These four variables, which all show a marked gender gap, were used to calculate a material bias score. After appropriate adjustments, they were averaged to yield a grand mean, which was then treated as a material bias score for each country.
All variables relating to non-material biases were included in the analysis. Figure 2 presents these on a radar plot. It is evident that the highest biases relate to workplace rights and the legal provision of quotas for women’s participation in politics.
Material biases were then plotted on an x axis and non-material biases on a y axis by country (see Figure 3). This placed each country as a point in a scatterplot. In addition, each country’s female population size was used to adjust the size of the country’s corresponding point. Finally, the proportion of female youth in each country was represented by the colour of the point, with more yellow = more female youth.
Figure 3: Material v non-material biases
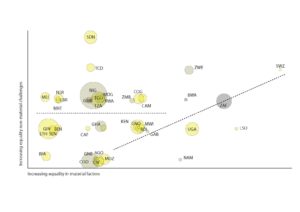
By creating different size points, with differing shades of yellow, it becomes possible to isolate higher priority countries. Those countries that have greater female population sizes, and higher proportions of female youth (for example, circles that are bigger and yellower) have the most urgent call to address issues affecting gender.
Finally, a regression line was fitted to the plot; the curve is shown as a blue-dotted line. This line was split by region. The one on the right-hand side of the graph reflects southern Africa (Angola, Botswana, Lesotho, Malawi, Mozambique, Namibia, South Africa, Eswatini, Zambia and Zimbabwe). The one on the left-hand side is the rest of sub-Saharan Africa. These lines provide a summary of the relationship between the x and y axes. It is evident from these that there is a different relationship between non-material and material factors in the two regions.
Overall, however, one could expect that if the reduction of non-material discrimination leads to a move towards material equality, then there should be a negative slope to the data. This is not, however, the case. In fact, in southern African countries the data suggests that increasing non-material challenges are related to higher material equality. Why this is the case is not evident. It may be that the data has not adequately captured the complexity of this relationship. Or it may be that the nature of the relationship changes in the various parts of Africa. Or it may be that the two are simply unrelated.
Putting these issues of interpretation aside, and aiming merely to describe how countries are doing, we highlighted two important regions within the plot. These are presented in Figure 4. The red area represents high challenges and low progress toward alleviating material inequality – where it is not good to be, if you’re a country. The green area refers to low challenge and high progress towards alleviating material inequality –where it is good to be if you’re a country. From this we can see that there are relatively few countries that have substantially reduced their material inequalities, on the right-hand side. Still fewer fall into the green area, in which they have both made high progress towards alleviating material inequality and removed most non-material challenges.
Figure 4: Material v non-material biases with challenge and progress areas
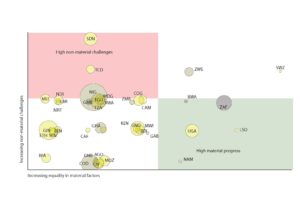
Countries on this green area (especially towards the bottom right) tend to have done what they can to eliminate discrimination and also have low material inequality. Countries on the lower left-hand side have done what they can to eliminate challenges but have not reduced material inequality. Those on the top right of the plot are doing well but could do better if they address some of the challenges; while those on the top left have high material inequality and many challenges still to overcome. Larger and yellower circles are more important than smaller, blacker ones.
From this, we can see that the majority of countries fall in the middle range of the challenge variable. They have work to do, but are not extreme. There are a group of countries at the lower edge of the y axis that have done much to eliminate challenges but for some reason still experience material inequality, or are perhaps in the process of making progress. South Africa, Botswana, Uganda, Namibia and Lesotho are in a good position, according to this model.
Figure 5: Material v non-material biases with high priority details
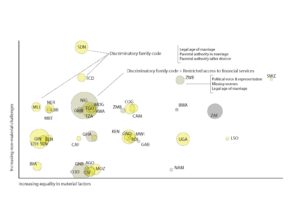 Of more concern are those countries in the top left, red, area of the plot. Sudan, Chad, Niger and Mali are in the worst position. Their having a high proportion of female youth in their population compounds this; the fact that there are young women who are empowered introduces issues of youth and youth bulge problems, in addition to those purely related to women.
Another group of concerning countries consists of Tanzania, Togo and Rwanda, falling high up on the challenges axis and also showing a high proportion of female youth. Nigeria is also concerning. Although it does not display a high proportion of young females, the size of its population means that one cannot ignore its precarious position, edging towards the upper half of the non-material challenges axis.
A closer look at these “problem countries” gives some indication of where they are falling short regarding non-material challenges. These are presented in Figure 5. The Mali, Niger, Sudan and Chad group all lose points on variables related to discriminatory family codes. More specifically, they fall short on the legal age of marriage and whether women are as entitled as men for parental authority during and after marriage. In short, these countries exhibit cultural patterns that discriminate against women through the family. The Tanzania, Rwanda, Togo group exhibits similar sets of issues; discriminatory family codes are once again an issue, albeit to a lesser extent. In addition to this, however, this group falls back with regards to restrictions on women’s access to financial services.
The only other country that falls towards the high end of the challenges scale is Zimbabwe. The challenges here are very different to the previous countries; in Zimbabwe, non-material challenges relate to women being deprived of a political voice and not having adequate political representation. In Zimbabwe, the number of missing women and the low legal age of marriage are also issues.
This brief little analysis of material inequalities and non-material discriminatory factors in the sub-Saharan region has provided some preliminary insights and raised some interesting questions. Preliminary insights are that Sudan, Chad, Mali and Niger have much to achieve regarding the reduction of non-material discrimination. These challenges appear to be embedded in family practices and values and relate to women’s agency around the institution of marriage. Whether these issues are religiously derived is unclear.
Tanzania, Rwanda, Togo is another group faced with high levels of non-material discrimination; once again family practices and values are the issue, although less severely so than is the case with the previous group. Access to financial services is also an issue with this group. With the exception of Zimbabwe, which has its own unique set of challenges, it appears that family is the main point of discrimination in sub-Saharan Africa. It must be said that a more thorough analysis would be required to state this point with certainty.
An interesting question has also been raised; there appears to be no relationship – or the opposite relationship than was expected – between non-material and material phenomena. Yet it seems intuitively obvious that the two should be related. This provides a modification of the age-old social theory question: do material conditions influence non-material conditions? Or do non-material conditions influence material conditions? Or, indeed, are they unrelated?

Vaughan Dutton is a chartered research psychologist and associate fellow of the British Psychological Society, with 18 years’ social research experience gained at senior levels in commercial, government and academic contexts. He has taught social research methods, social theory and psychological theory at a number of universities in South Africa and the UK. Currently a consultant, he is also completing a doctorate in psychotherapy. He studied research psychology (applied social research) in South Africa, and holds a research doctorate from the University of Oxford.